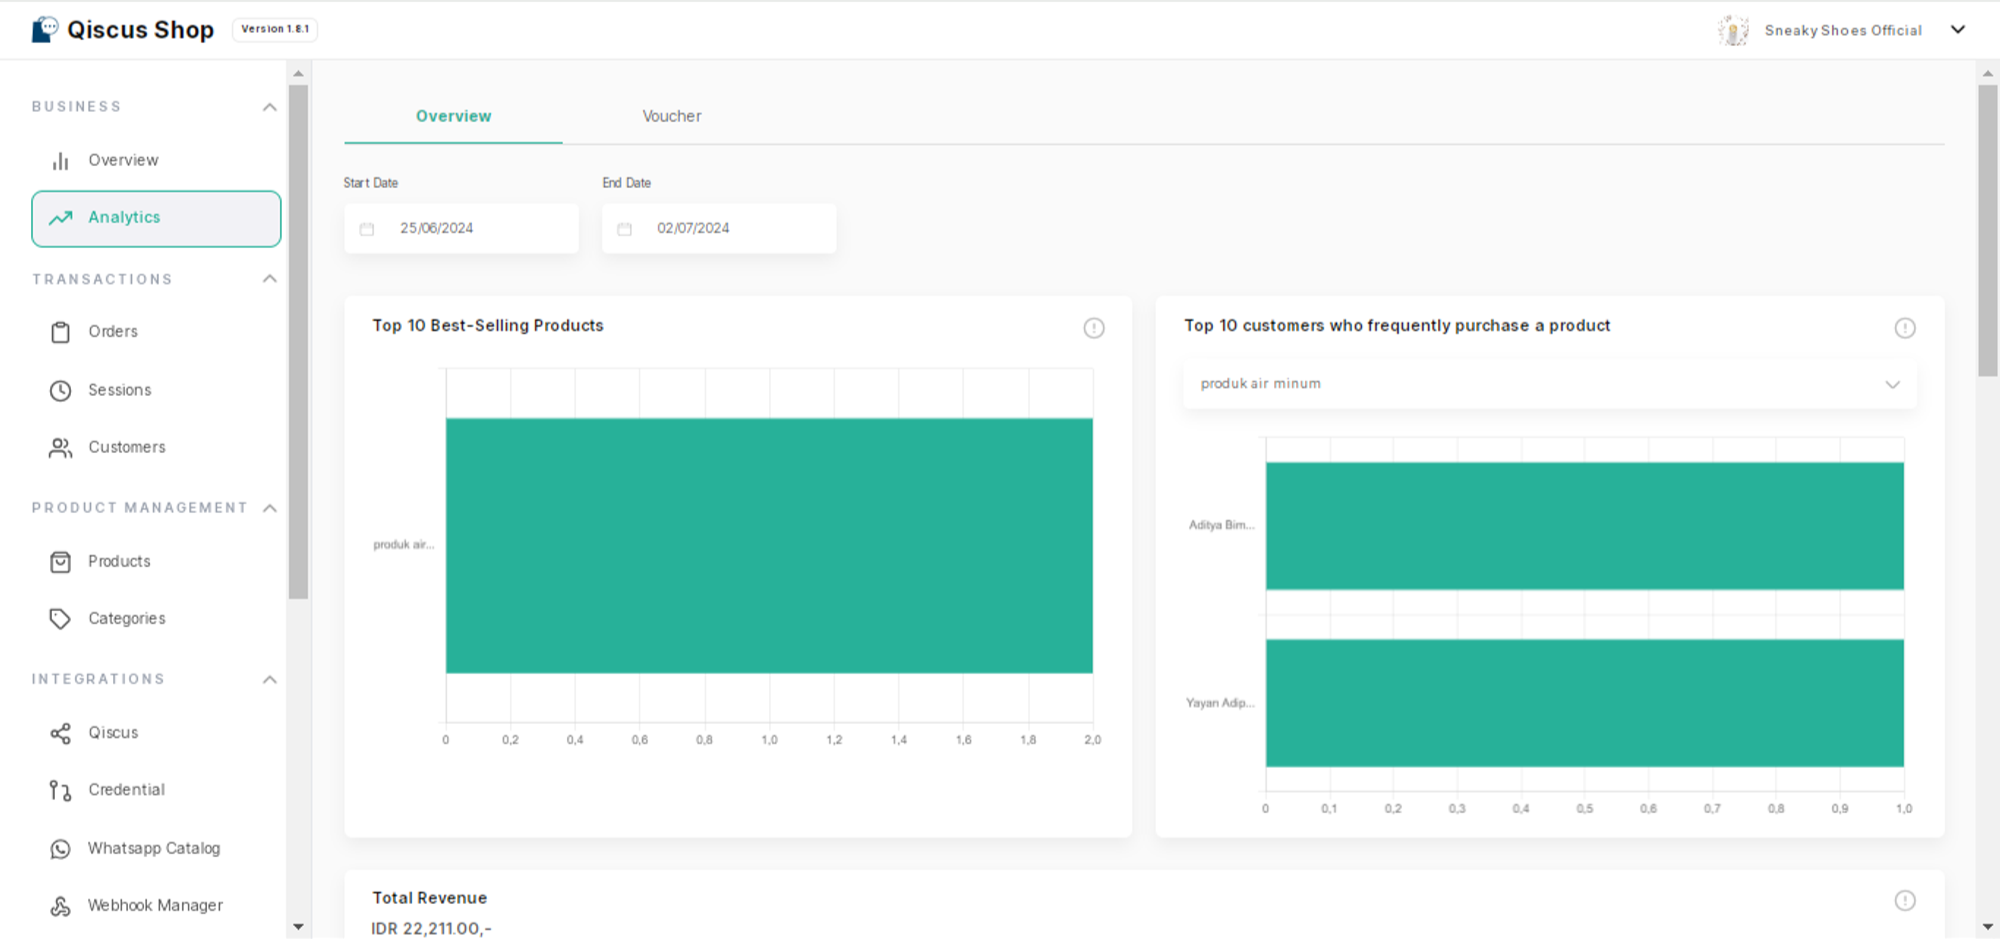
Overview
The analytics menu in Qiscus Shop encompasses tools and reports designed to provide comprehensive insights into the performance of your online store. These analytics empower store owners to make informed decisions, optimize marketing strategies, and enhance overall business performance.
Top 10 Best-Selling Products
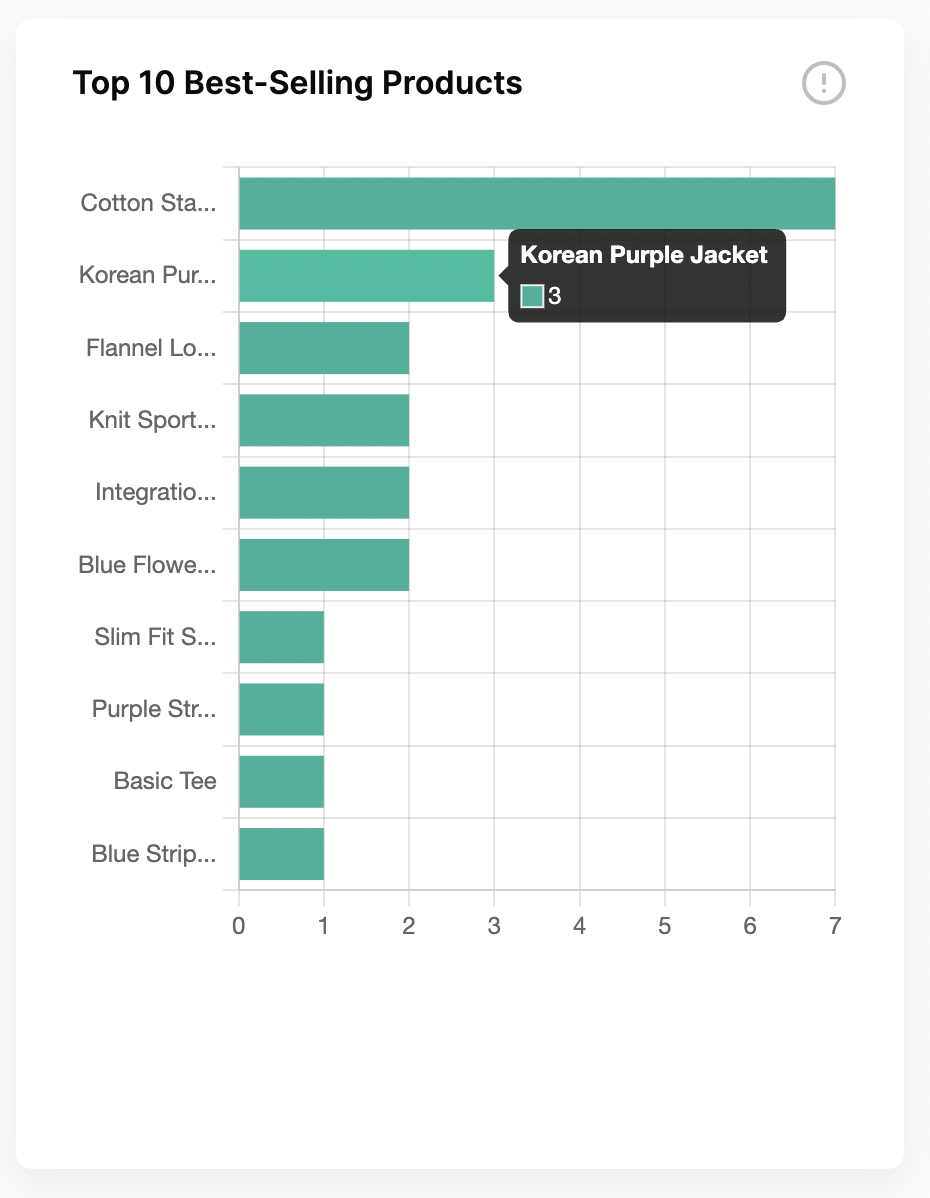
Displaying the top 10 Best-Selling Products sold through Qiscus Shop based on a specific date range. The product list will be influenced by product purchases made within a specific date range, so the number of products listed may be less than 10.
Top 10 customers who frequently purchase a product
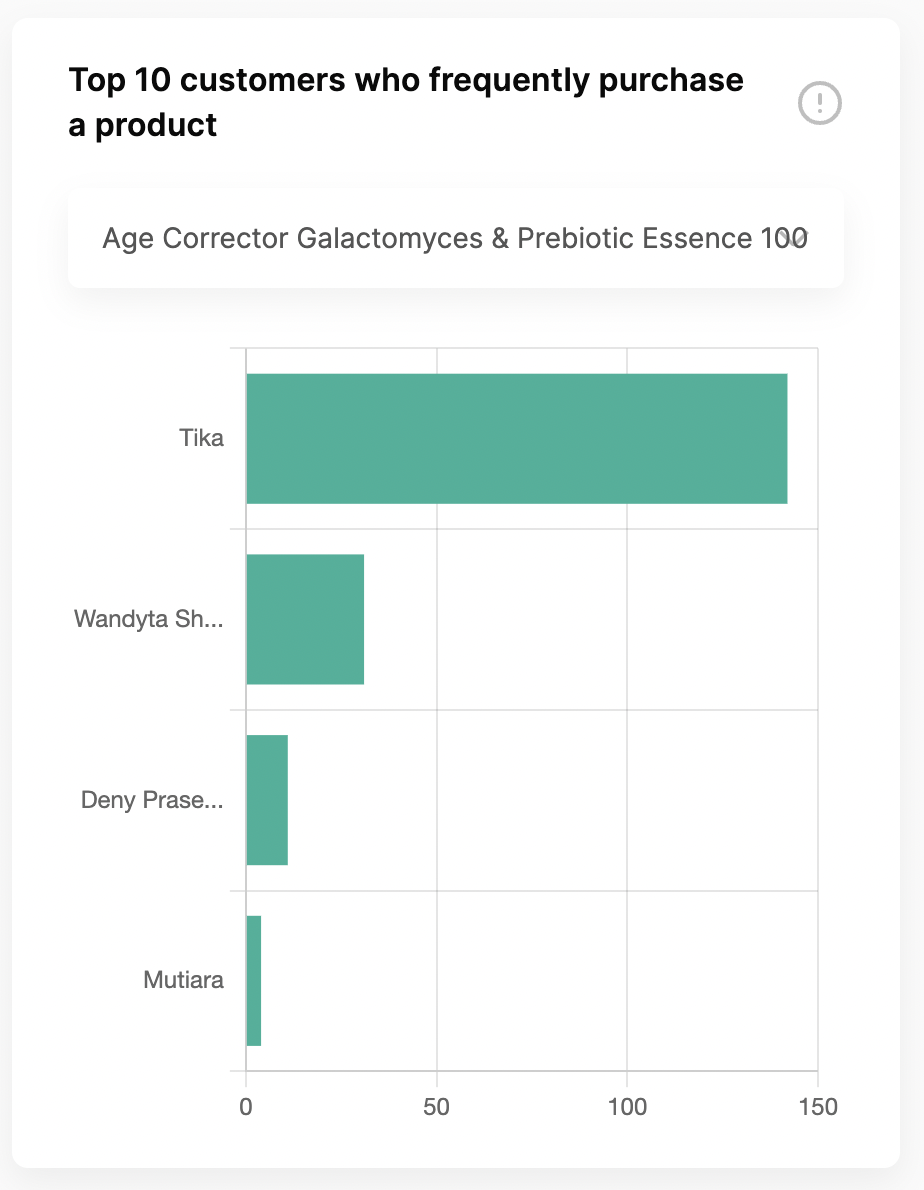
Displaying the top 10 customers with the highest purchases on a specific product based on a specific date range.
We only show product that has been sold in the specific date range.
The customer list will be influenced by product purchases made within a specific date range, so the number of products listed may be less than 10.
Total Revenue
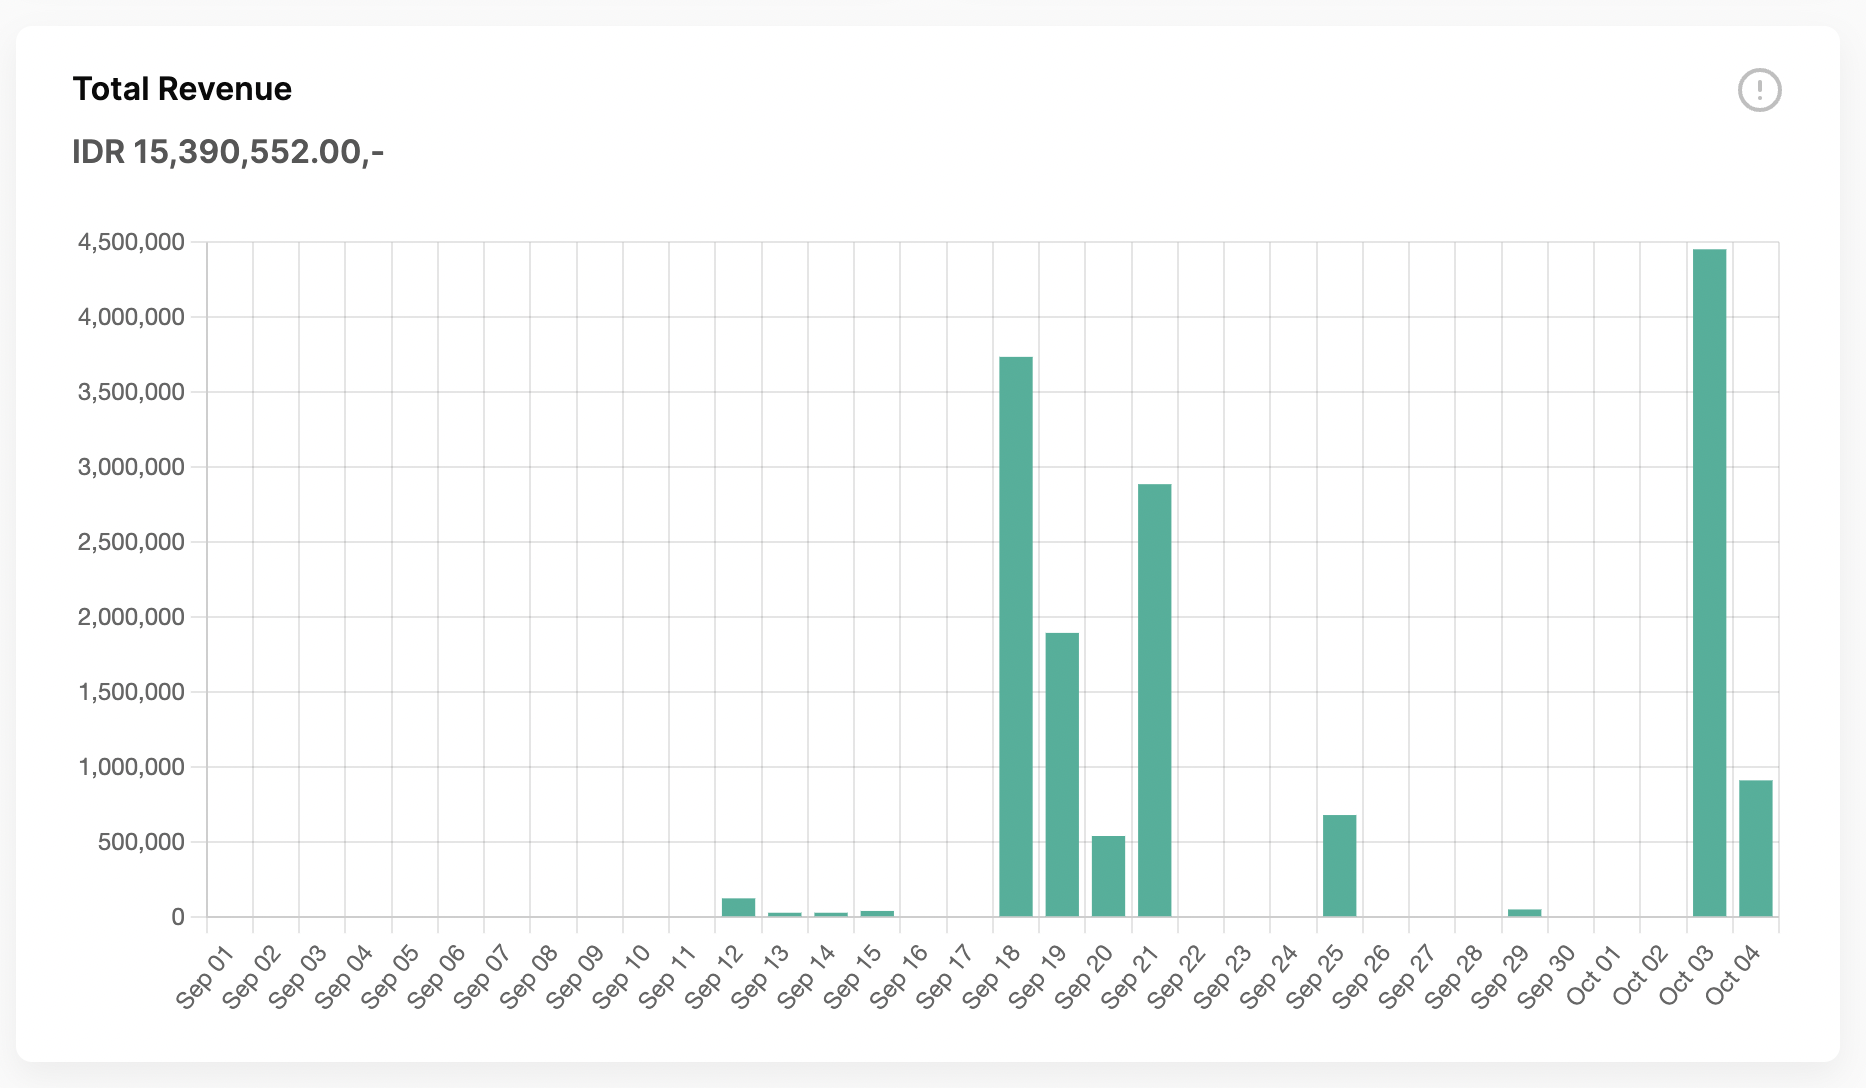
Displaying the Total Revenue from orders with order statuses as paid, sent, packed, & completed and detailing it using a time series based on a specific date range.
Total Order
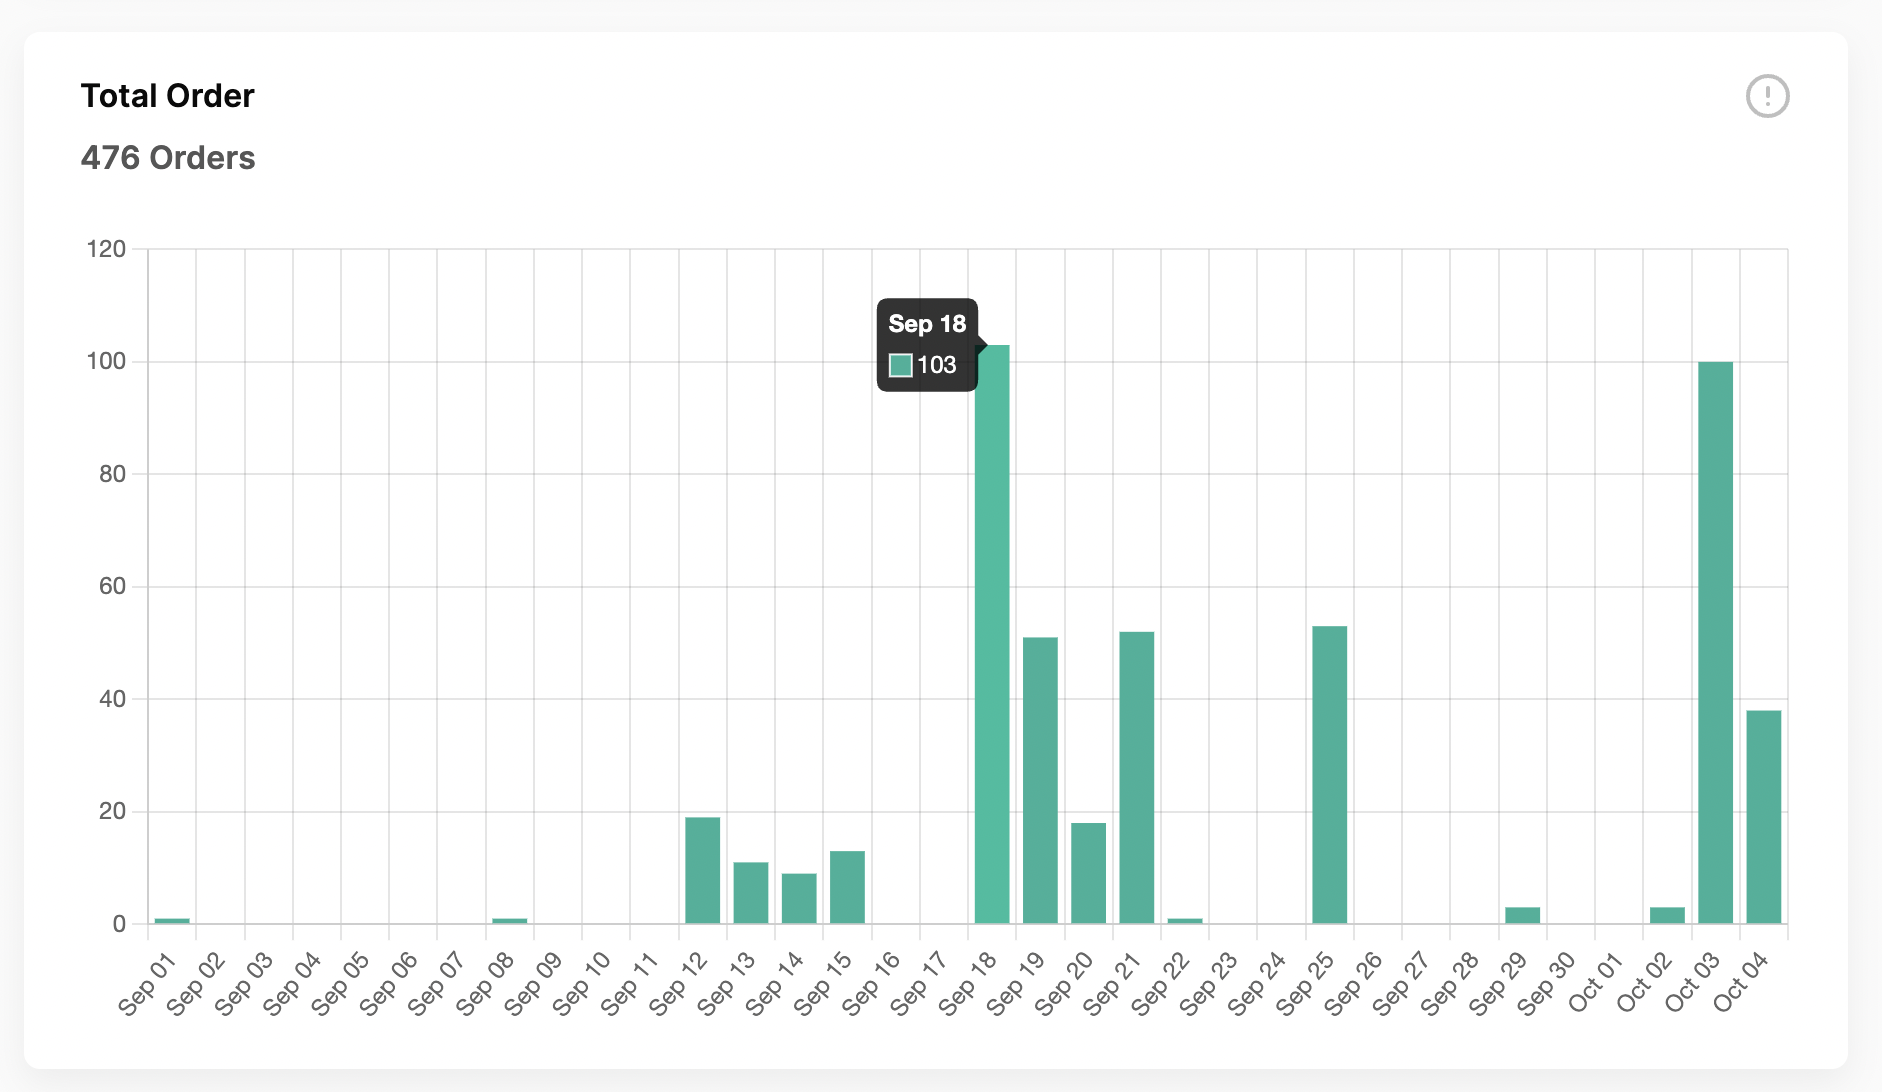
Displaying the Total Orders (all statuses) that have been created and detailed using a time series based on a specific date range.
Total Order Status
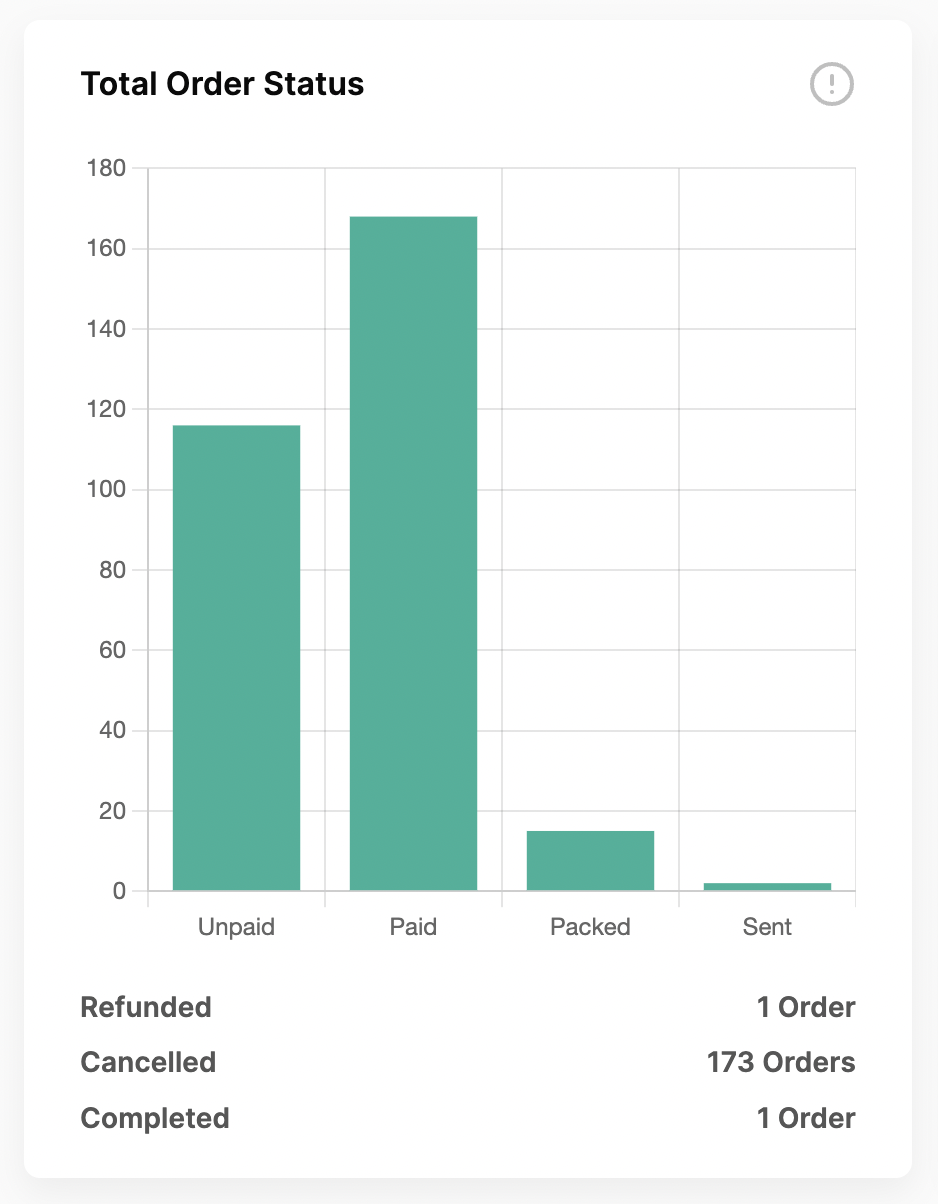
Showing the Total number of Orders based on statuses. Unpaid, Paid, Sent, and Packed are temporary status and will change as operations progress. Complete, Cancelled, and Refunded are the final statuses for each order.
Purchase Statistics Per Channel
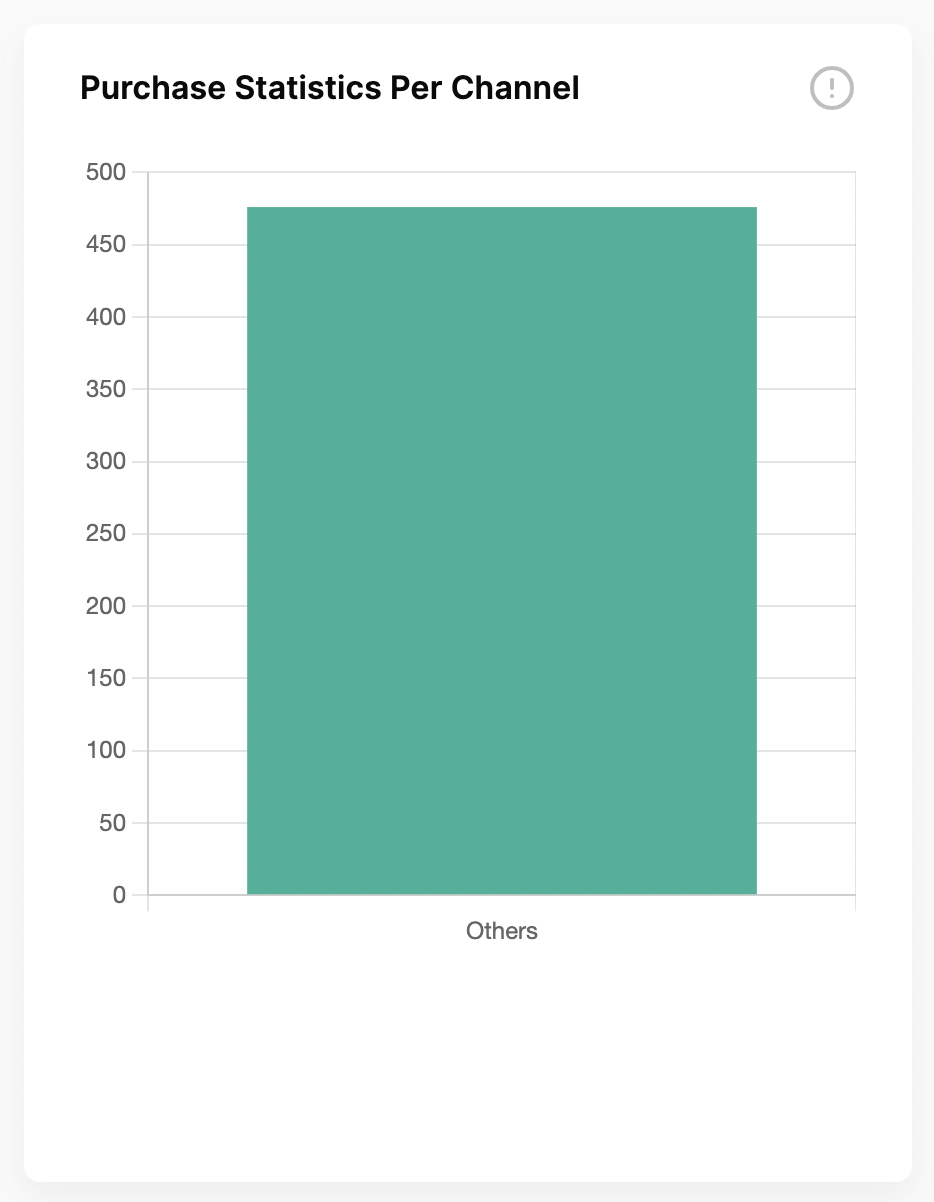
Displaying the total number of orders that occurred per channel, if there are orders that cannot be identified with any channel, they will be categorized as 'others
Voucher Analytics
You can choose the time you want to see a performance chart of the vouchers your shop has over a period of 7 days.
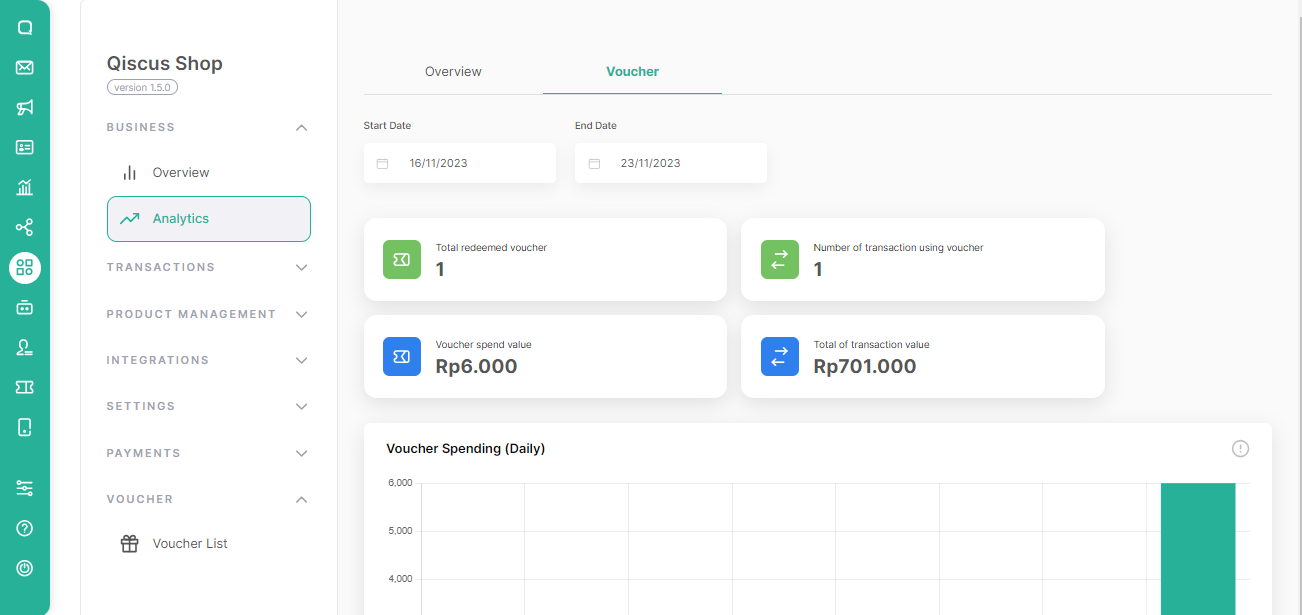
The Voucher Analytics menu provides users with a comprehensive snapshot of key analytics and metrics related to the store voucher's performance and customer interactions. It offers valuable insights into the following categories:
Total Redeemed Voucher: This metric displays the total vouchers that were successfully claimed by the buyer after the buyer checked-out.
Number of Transaction using Voucher: This highlight section displays the complete number of transactions using vouchers.
Voucher spend value: This metric highlight displays the total value of vouchers that have been used. It provides an understanding to the dashboard admin of the accumulated amount of discounts given from the vouchers used.
Total of the transaction value: This metric displays the total value of transactions that occur using vouchers. This section contains information on transaction values resulting from Merchandise and Shipping.
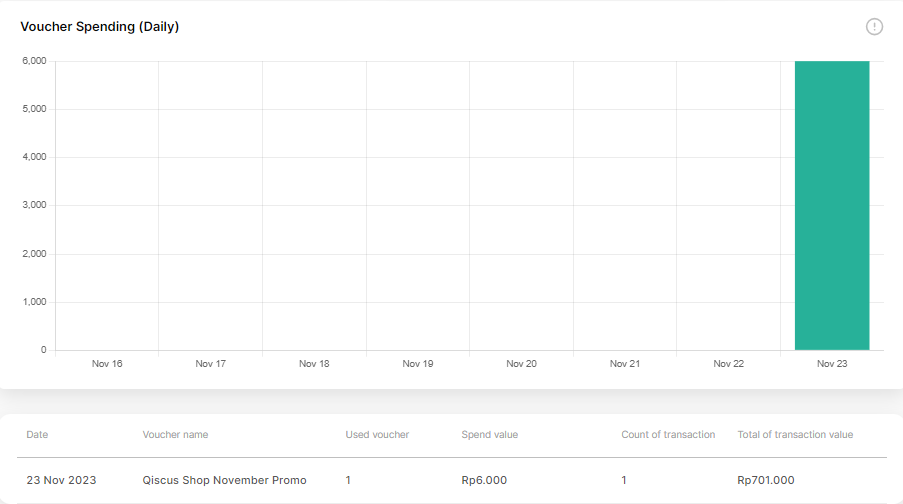
Voucher Spending (Daily)
Displays the total value of vouchers that have been used by buyers based on the specific date range. This bar chart is influenced by the predetermined voucher period, allowing the bar chart to be empty outside the predetermined voucher period.
Table Voucher
The voucher table encompasses details about transactions involving vouchers, including the following data:
Date: The date of the transaction.
Voucher Name: The name of the voucher that was used.
Used voucher: The overall number or sum of vouchers utilized.
Spend value: The nominal value of the overall voucher used in transactions.
Count of transaction: The number of transactions completed with the referenced voucher.
Total of transaction value: The cumulative nominal value of completed transaction after using the referenced voucher (including the shipping fee).
Flash Sale Analytics
Flash Sale Analytics provides admins with detailed insights into the performance of flash sale campaigns. It helps measure sales, revenue, and discounts granted during promotional periods, making it easier to evaluate marketing costs and campaign effectiveness.
All sections in Flash Sale Analytics support filtering by:
Date Range → show data within a specific period.
Flash Sale Campaign → show data for a specific campaign.
These filters apply across summary boxes, performance charts, top lists, product details, and order history.
Summary Box
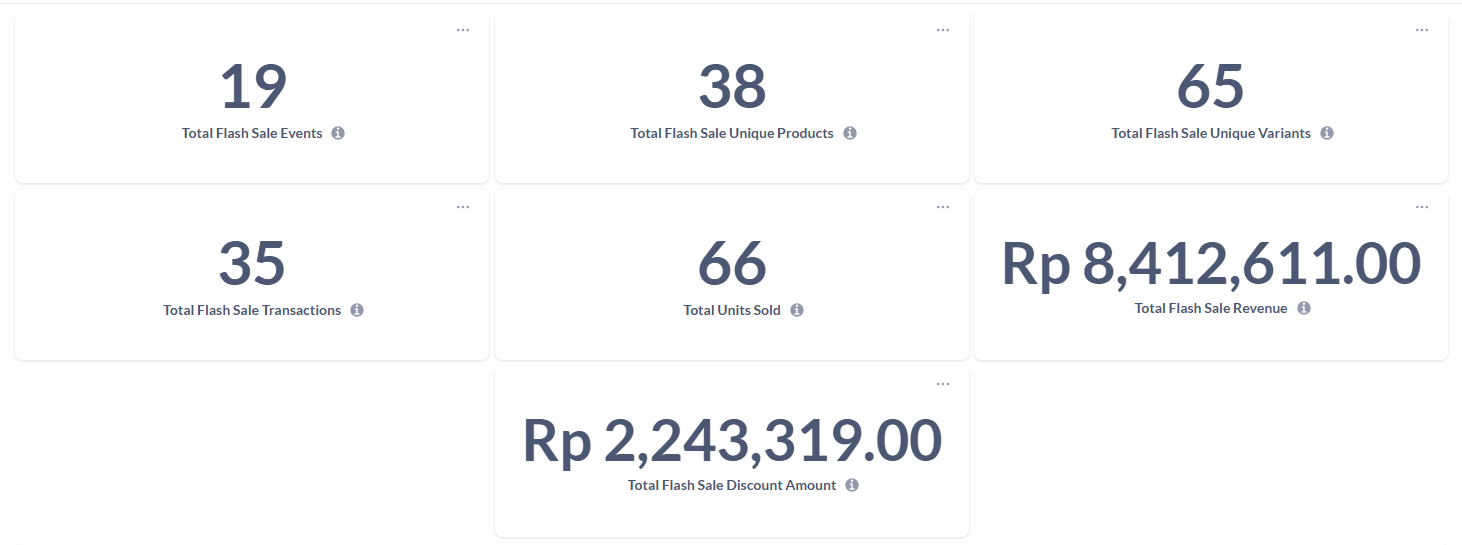
The summary box gives admins a quick overview of all flash sale activities (both ongoing and ended). It aggregates campaign counts, product coverage, transaction volume, and financial impact. The following metrics are displayed:
Total Flash Sale Events → number of campaigns created.
Total Flash Sale Unique Products → unique products included (counted once even if repeated).
Total Flash Sale Unique Variants → unique variants included (counted once even if repeated).
Total Flash Sale Transactions (Lifetime) → number of transactions that contained flash sale products, counted only from orders with status Paid up to Completed.
Total Units Sold (Flash Sale) → total units of flash sale products sold, counted only from orders with status Paid up to Completed.
Total Flash Sale Revenue → total transaction value from flash sale products, calculated only from orders with status Paid up to Completed.
Total Flash Sale Discount Amount → total discount value granted from flash sale products, calculated only from orders with status Paid up to Completed.
Flash Sale Performance (Daily)
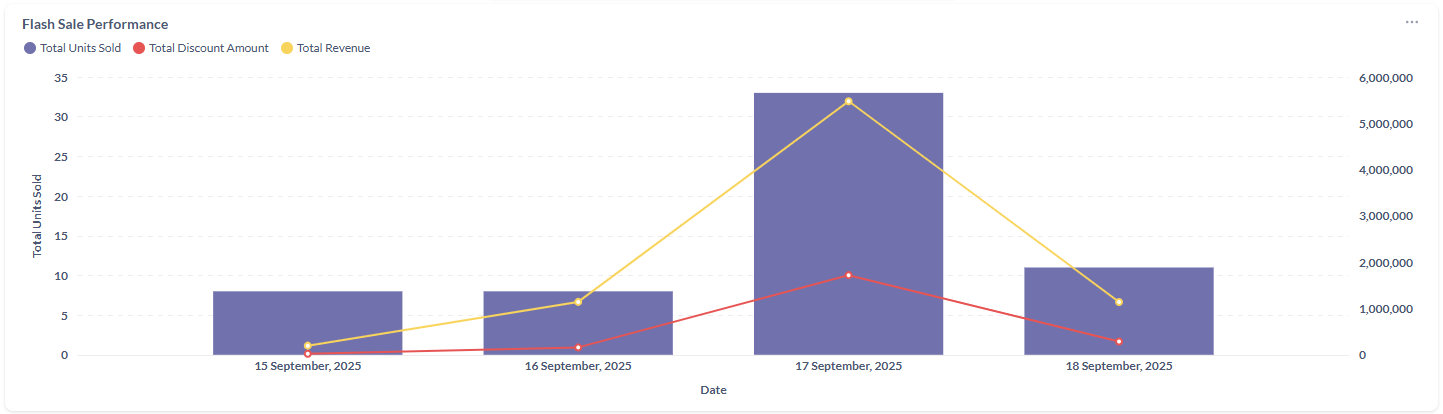
This section visualizes daily sales and discount performance during flash sale campaigns. It allows admins to track how campaigns perform on specific days and compare trends across events. Metrics include:
Total Revenue → daily transaction value from flash sale products, based on orders with status Paid up to Completed.
Total Discount Amount → daily discount value granted, based on orders with status Paid up to Completed.
Units Sold per Day → number of units sold each day, based on orders with status Paid up to Completed.
Top 10 Best Selling Products
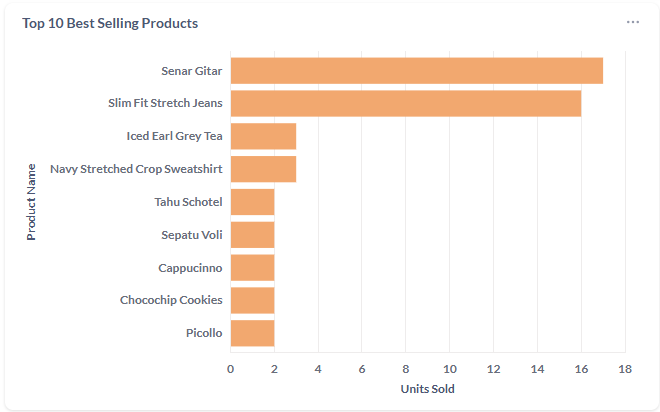
A ranking of the ten best-selling product variants that participated in flash sale campaigns. This chart helps admins quickly identify which variants performed the best in terms of sales volume.
Top 10 Most Successful Flash Sales
This section highlights the top-performing flash sale campaigns overall. Each campaign is evaluated by sales volume, revenue, and discount amount, as well as order fulfillment and conversion. Metrics include:
Flash Sale Name & Period
Total Units Sold → units sold, counted from orders with status Paid up to Completed.
Total Revenue → transaction value, from orders with status Paid up to Completed.
Total Discount Amount → discount value granted, from orders with status Paid up to Completed.
Total Orders → all orders created (unpaid, cancelled, refunded, completed).
Fulfilled Orders → orders successfully processed (Paid → Completed).
Conversion Rate → percentage of orders successfully paid compared to all orders created.
Flash Sale Product List
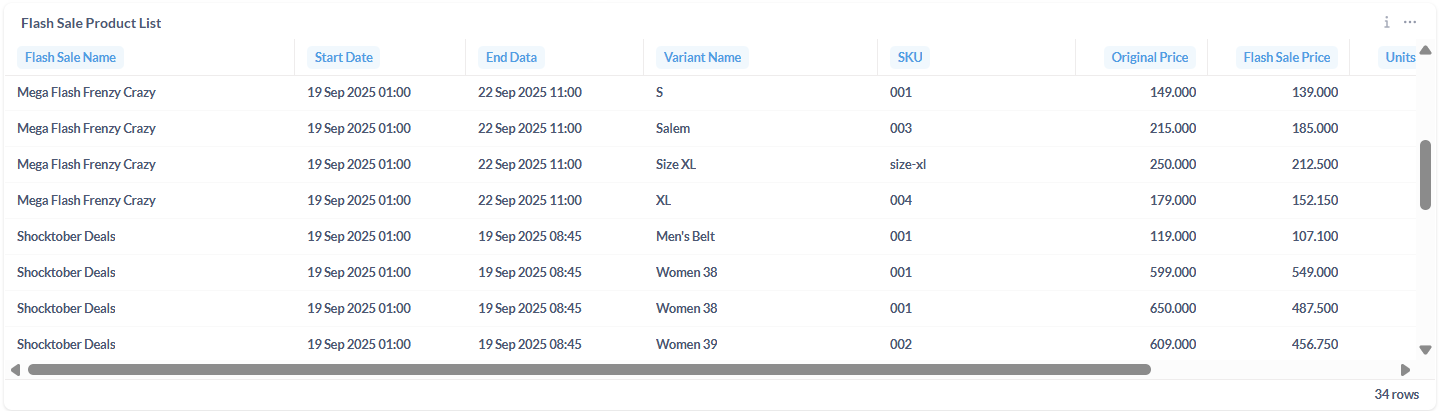
A detailed table that breaks down performance per product variant within each flash sale event. This view is particularly useful for finance and inventory tracking. Each row shows:
Campaign name and period
Variant name and SKU
Original price and flash sale price
Units Sold → from orders with status Paid up to Completed.
Revenue → from orders with status Paid up to Completed.
Discount Amount → total discount value for the variant during the campaign.
Flash Sale Order History
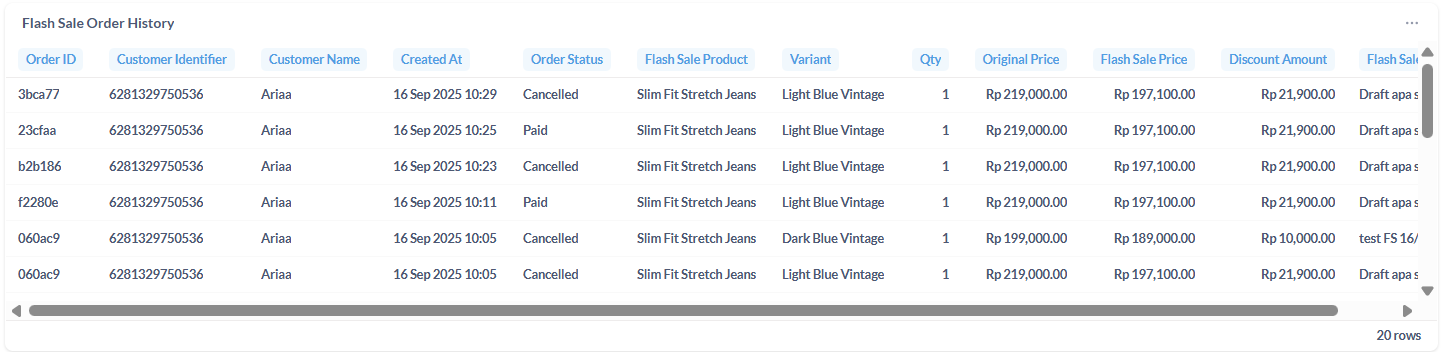
Order-level detail for all transactions that included flash sale products. This history covers campaigns that are ongoing or ended, and displays orders in all statuses. Each record includes:
Order ID, customer, created time, order status
Product & variant purchased, quantity
Original price, flash sale price, and discount amount
Flash sale campaign name
Custom Analytics
Contact us to have an analytics that personalized and suit your business.